New! Check out our free BigQuery cost analyzer - built with Hashboard BI-as-code

Our approach

Hashboard believes that data itself is a product. And that data people are product people too.

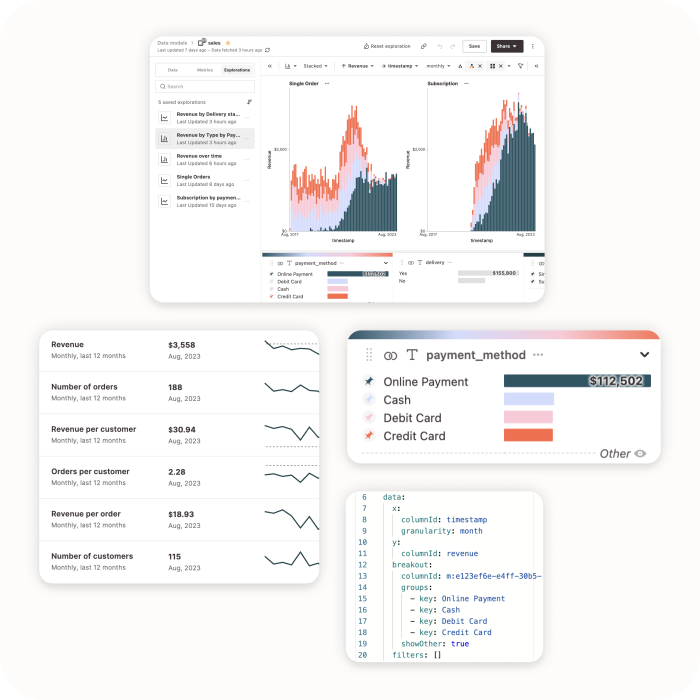
Hashboard is an opinionated BI tool that hopes to make your organization love data again by simplifying exploration and allowing you to publish data in a consistent, high quality and beautiful way.

Our goal is to simplify: our interface, how you interact with data and how your organization thinks about data.

Hashboard is an ode to data product people everywhere.

Product approach

  1. A user should never start with a blank canvas and be asked to conceive of analysis from scratch.

  2. BI should simplify your story; you probably don't need more than ten chart types.

  3. Sometimes you want your BI to work exactly like code: checked in, run in continuous integration, with upstream dbt models (or other transformation tool).

  4. Sometimes you want your BI tool to work nothing like code at all: one-off charts and queries and totally ad hoc and free wheeling.

How to develop data and teams

  1. Your output isn't a dashboard or a chart, a data model or a single insight – it's knowledge and understanding.

  2. Don't reduce your work to just a "decision factory." It's not only about making decisions.

  3. Many decisions don't need data.

  4. Only start to use data when you have enough of it. When you're early and you only have ten users, you can just ask them what they think.

  5. Data is most powerful when it scales empathy: you can talk to a single user or talk to a single patient. You can't talk to a hundred thousand users. Data can let you talk to 100,000 users.

  6. Think about the end-to-end value of your pipeline: from when data is collected to where it is consumed.

  7. The data pipeline ends in the minds of people in your organization.

  8. Your data team should be distributed and gain as much context on the domain as possible.

  9. People who consume data should get context on business rules and get involved in how data is constructed.

  10. Publish and share once you figure something out

  11. Data has users – you should have empathy for them.

Data modeling for usability

  1. One Big Table, Star Schema and Snowflake schemas are the only suitable ways to model users for broad consumption. Subjecting users to complex joins in a UI is bad for usability and understanding.

  2. Mixing grains in a single data view should be done carefully and intentionally (not incidentally and accidentally).

Build a collaborative data culture

Start with a 30-day free trial