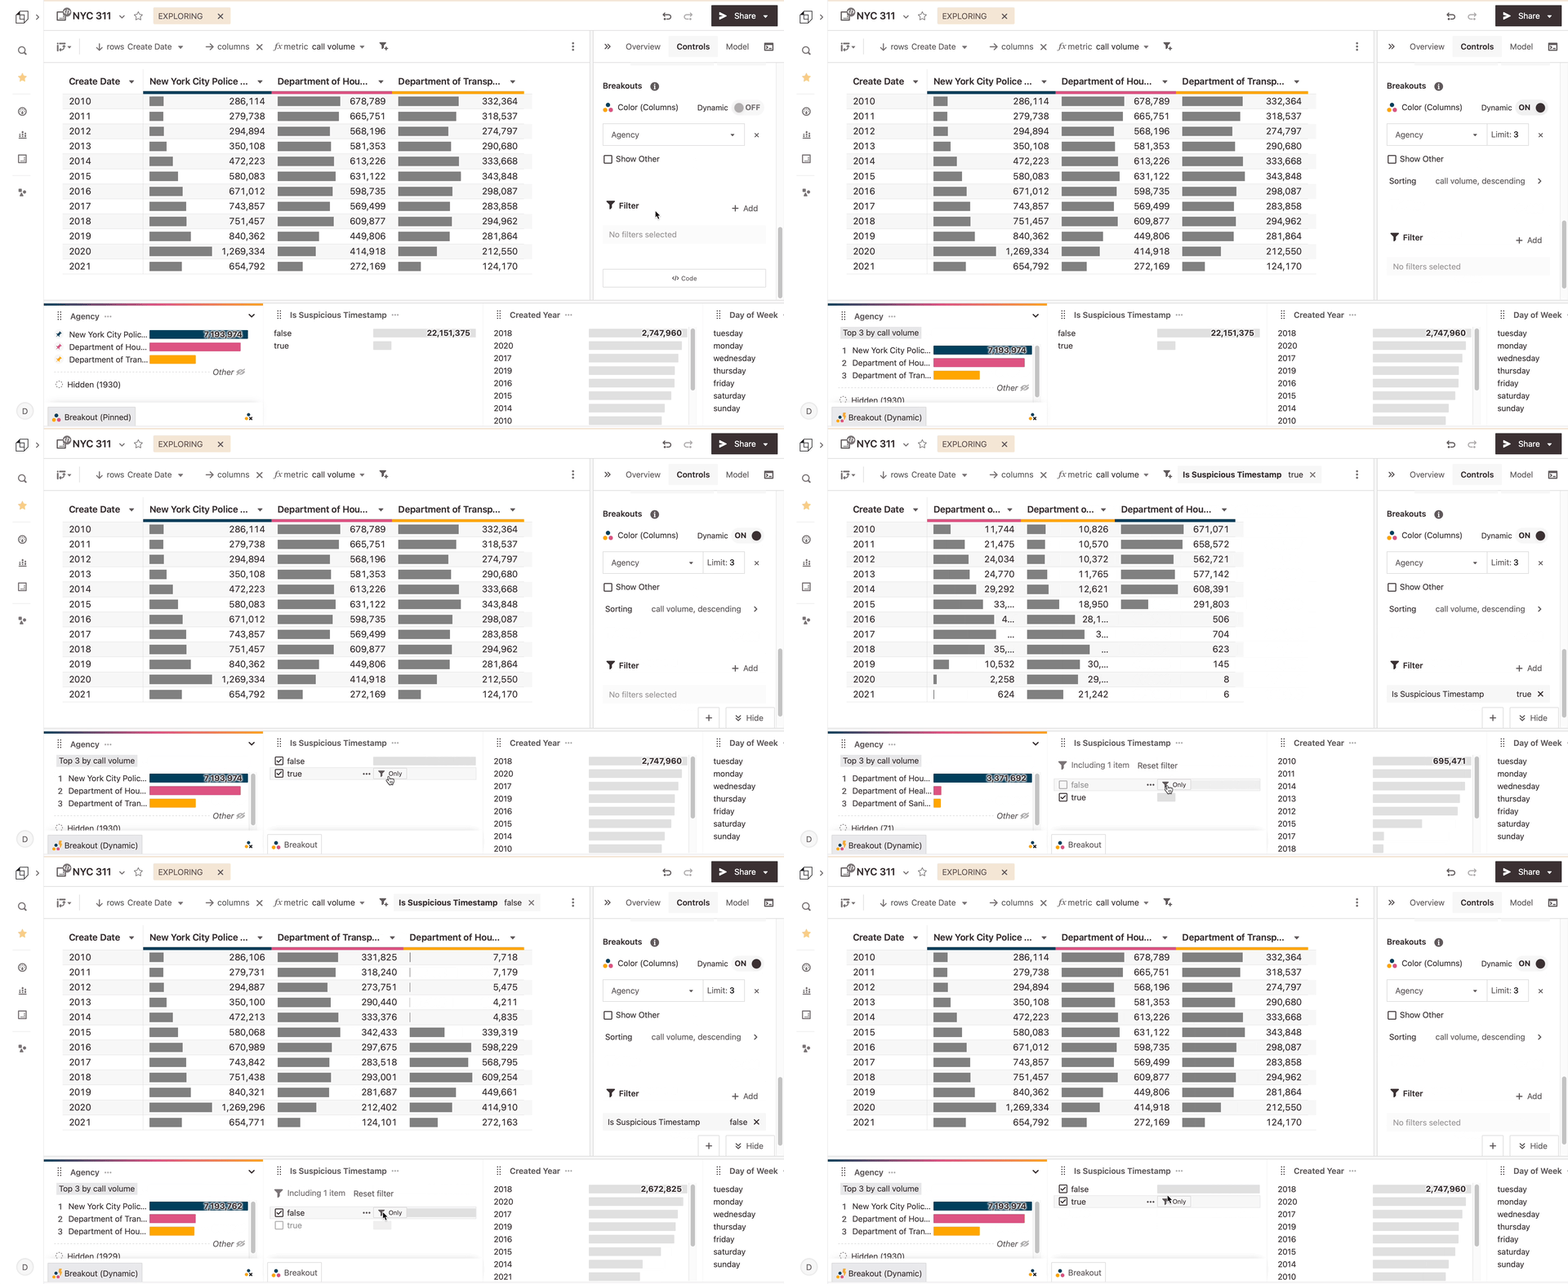
Dynamic Breakouts

Breakouts in Hashboard have always allowed you to pick a set of attributes to track. For example, you can breakout seven customers that are particularly important and track their product usage. Breakouts keep comparison sets manageable and charts looking good. This is a core Hashboard feature which we love!
With the addition of ⚡️ Dynamic Breakouts, you can now define criteria that adapts your breakout as your data changes. For example, you could always track the top 20 revenue customers, or you could track the six most recent cohort months.
Dynamic Breakouts allow you to always look at the most relevant data in an easy-to-digest way. Here’s an example in our demo site: this retention curve will always look at the three most recent years in the data and group all the other years together.