Metric Tiles

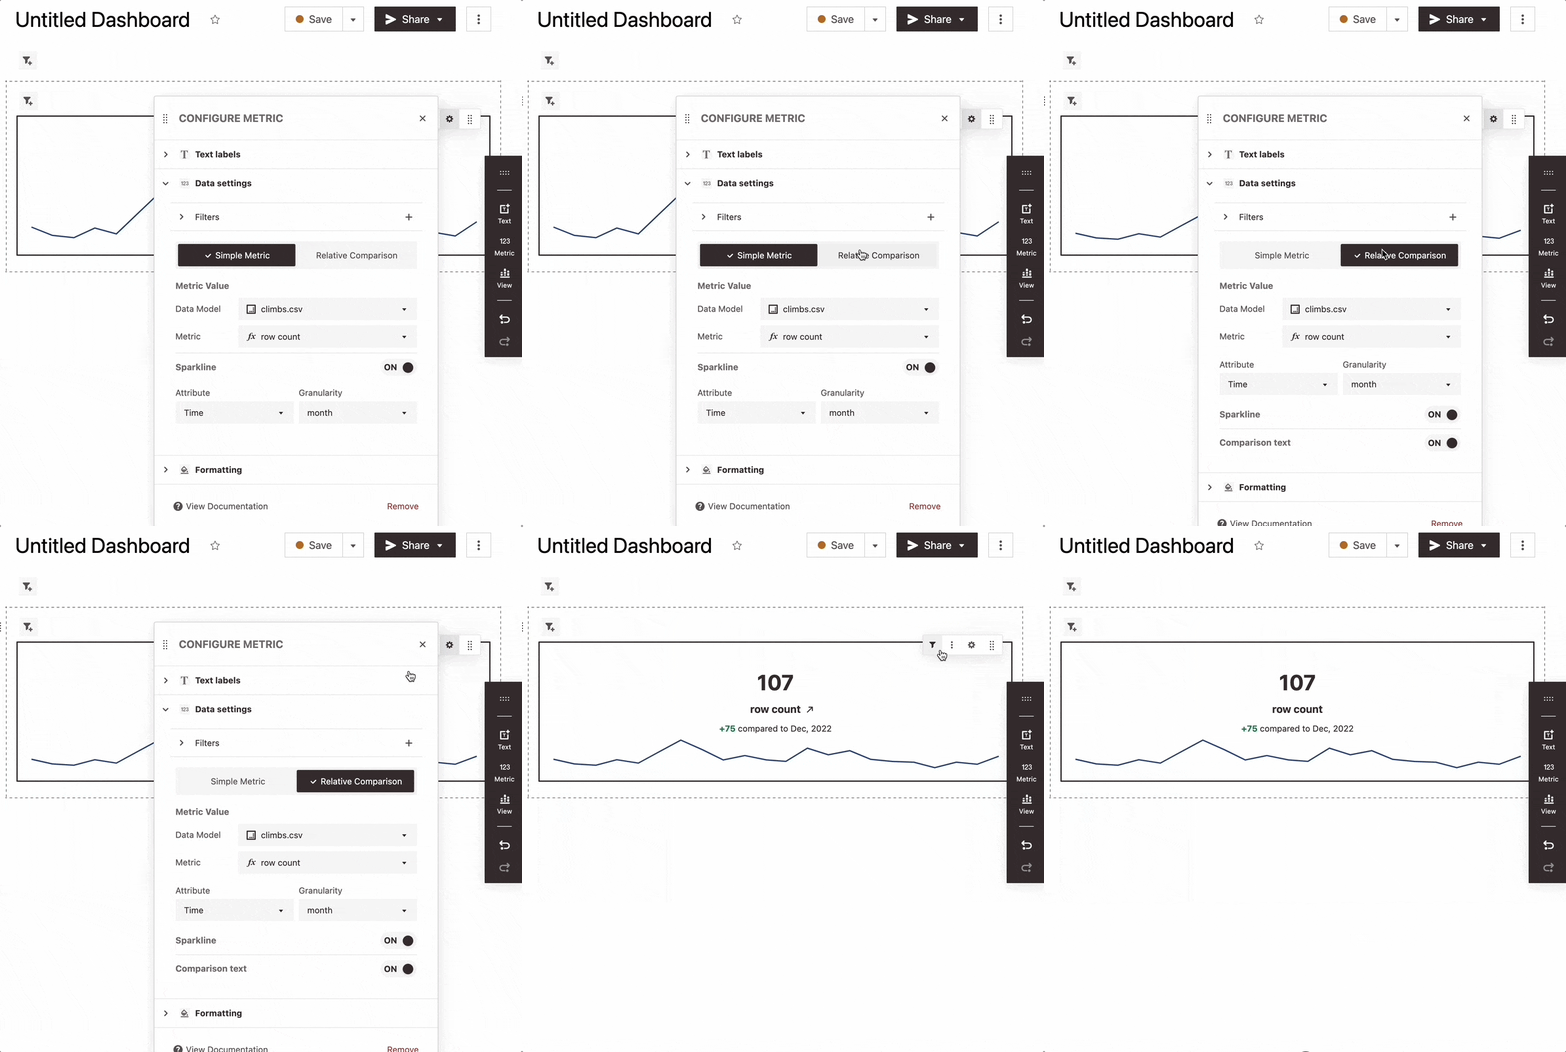
We’ve added several enhancements to our dashboard Metric Tiles! You can now easily monitor key metrics with sparklines and comparisons. Your team can now get a comprehensive sense of how all of your metrics are performing at a glance.
You can also configure tiles to display the latest value instead of the total. For example, you can show yesterday’s user count instead of total user count. Read more in our docs.